175p
> to divide an image into parts with a strong correlation with objects or areas of the real world contained in the image
- complete segmentation
: lower-level (context independent processing using no object-related model)
- partial segmentation
: dividing an image into separate regions that are homogeneous with respect to a chosen property (such as brightness, color, reflectivity, texture, etc)
http://en.wikipedia.org/wiki/Segmentation_(image_processing)
> segmentation methods
(1) global knowledge - a histogram of image features
(2) edge-based segmentations <-
edge detection
(3) region-based segmentations <-
region growing
eg. (2) + (3) => a region adjacency graph
http://www.mathworks.com/matlabcentral/fileexchange/loadFile.do?objectId=16938&objectType=FILE
cf. topological data structure
176p
6.1 Thresholding
Thresholding
: the transformation of an input image to an output (segmented) binary image
interactive threshold selection / threshold detection method
> gray-level
global thresholding
using a single threshold for the whole image
adaptive thresholding
using variable thresholds, dep. on local image characteristics
(<- non-uniform lighting, non-uniform input device parameters)
band thresholding
using limited gray-level subsets
(-> blood cell segmentations, border detector)
+ multiple thresholds
semi-thresholding
human-assisted analysis
> gradient, a local texture property, an image decomposition criterion
http://en.wikipedia.org/wiki/Thresholding_(image_processing)
179p
6.1.1 Threshold detection methods
p-tile thresholding
<- prior information about area ratios
histogram shape analysis
: gray values between the two peaks probably result from border pixels between objects and background
multi-thresholding
mode method
: to find the highest local maxima first and detect the threshold as a minimum between them
to build a histogram with a better peak-to-valley ratio
(1) to weight histogram contributions to suppress the influence of pixels with a high image gradient
(2) to use only high-gradient pixels to form the gray-level histogram which should be unimodal corresponding to the gray-level of borders
histogram transformation
hitogram concavity analysis
entropic methods
relaxation methods
multi-thresholding methods
ref.
A survey of thresholding techniques
Computer Vision, Graphics, and Image Processing, 1988
PK Sahoo, S Soltani, AKC Wong, YC Chen
180p
6.1.2 Optimal thresholding
optimal thresholding
: using a weighted sum of two or more probability densities with normal distribution
"estimating normal distribution parameters together with the uncertainty that the distribution may be considered normal"
ref.
Rosenfeld and Kak, 1982
Gonzalez and Wintz, 1987
minimization of variance of the histogram
sum of square errors
spatial entropy
average clustering
ref.
An analysis of histogram-based thresholding algorithms
CVGIP: Graphical Models and Image Processing, 1993
CA Glasbey
The threshold is set to give minimum probability of segmentation error.
The method of a combination of optimal and adaptive thresholding:
(1) to determine optimal gray-level segmentation parameters in local sub-regions for which local histograms are constructed
(2) to model each local histogram as a sum of n Gaussian distribution
(3) to determine the optimal parameters of the Gaussian distributions by minimizaing the fit function.
Levenberg-Marquardt minimization
http://en.wikipedia.org/wiki/Levenberg-Marquardt_algorithm
183p
6.1.3 Multi-spectral thresholding
to determine thresholds independently in each spectral band and combine them into a single segmented image
to analyze multi-dimensional histograms (instead of histograms for each spectral band)
pre-processing - adjusting region shape (eg. boundar stretching)
Regions are formed from pixels with similar properties in all spectral bands, with similar n-dimensional description vectors.
184p
6.2 Edge-based segmentation
Edges mark image locations of discontinuities in gray-level, color, texture, etc.
to combine edges into edge chains that correspond better with borders in the image
partial segmentation
- to group local edges into an image where only edge chains with a correspondence to existing objects or image parts are present
185p
6.2.1 Edge image thresholding
quantization noise, small lighting irregularities => edge image
p-tile thresholding
using orthogonal basis functions (Flynn, 1972)
Sobel Mask (<- 5.3.2)
http://en.wikipedia.org/wiki/Sobel_operator
Canny edge detection (<- 5.3.5)
http://en.wikipedia.org/wiki/Canny_edge_detector
simple detectors => thickening - (directional information) -> non-maximal suppression (Canny edge detection <- 5.3.5)
Non-maximal suppression of directional edge data:
(1) quantize edge directions
(2) inspect the two adjacent pixels indicated by the direction of its edge
(3) if the edge magnitude of either of these two exceeds that of the pixel under inspection, delete it
Hysteresis to filter output of an edge detector:
- if a pixel with suitable edge magnitude borders another already marked as an edge, then mark it too
Canny reports choosing the ratio of higher to lower threshold to be in the range 2 to 3.
edge context evaluation -> continuous border construction:
Based on the strength of edges in a specified local neighborhood, the confidence of each edge is either increased or decreased.
The outer region border is useful for deriving properties such as perimeter, compactness, etc.
inter-pixel boundary of adjacent regions -> extended borders:
The existence of a common border between regions makes it possible to incorporate into the boundary tracing a boundary description process.
-> an evaluated graph consisting of border segments and vertices
extended boundary (Fig. 6.18)
: obtained by shifting all the UPPER outer boundary points one pixel down and right,
shifting all the LEFT outer boundary points one pixel ot the right,
shifting all the RIGHT outer boundary points one pixel down,
and the LOWER outer boundary point positions remain unchanged
Extended boundary has the same shape and size as the natural object boundary.
(3) extended boundary tracing
Detecting common boundary segments between adjacent regions and vertex points in boundary segment connections is based on a look-up table depending on the previous detected direction of boundary and on the status of window pixels which can be inside or outside a region.
chain code
double-
linked lists
ref.
A contour tracing algorithm that preserves common boundaries between regions
CVGIP: Image Understanding
Yuh-Tay Liow, 1991
(4) multi-dimensional gradients
Edge gradient magnitudes and directions are computed in pixels of probable border continuation.
(5) finite topological spaces and cell complexes
-> component labeling (-> 8.1), object filling, shape description
197p
6.2.4 Border detection as graph searching
graph
: a general structure consisting of a set of nodes and arcs between the nodes.
costs
: weights of arcs
The border detection process ->
a search for the optimal path in the weighted graph + cost minimization
pixels - graph nodes weighted by a value of edge magnitude
edge diretions - an arcs matched with local border direction
(1)
A-algorithm graph search:
1. put all successors of the starting node with pointers to an OPEN list
2. remove the node with lowest associated cost
3. expand the node and put its successors on the OPEN list with pointers
4. if the node is the ending point, stop
The optimal path is defined by back-tracking.
(2)
pre-processing (straightening the image data) for thin, elongated objects:
The edge image is geometrically warped by re-sampling the image along profile lines perpendicular to the approximate position of the sought border.
(3)
gradient field transform (based on a graph-search)
The estimate of the cost of the path from the current node to the end node has a substantial influence on the search behavior.
breadth-first search
raw cost function; inverted edge image
optimal graph search vs. heuristic graph search
> the evaluation cost functions (for graph-search border detection)
1) strength of edges forming a border
"If a border consists of strong edges, the cost of that border is small."
2) border curvature
"Borders with a small curvature are preferered."
3) proximity to an approximate border location
"The distance from the approximate boundary has additive or multiplicative influence on the cost."
4) estimates of the distance to the goal (end point)
Gaussian cost transformation:
the mean of the Gaussian distribution - the desired edge strength
the standard deviation - the interval of acceptable edge strengths
a good path with a higher cost vs. worse paths with lower costs
=> expansion of 'bad' nodes representing shorter paths with lower total costs
(* But, a good estimate of the path cost from the current node to the goal is not usually available.)
> modifications
- pruning the solution tree
- least maximum cost
- branch and bound
- lower bound
- multi-resolution processing
- incorporation of higher-level knowledge
Graph searching techniques ensure global optimality of the detected contour.
> detection of approximately stright contours
1) geometrical transformation (: polar-torectangular co-ordinate transformation)
-> to straighten the contour
2) dividing line (to divide the image with the non-convex parts of the contour)
-> to search in opposite directions to separate
> searching without knowledge of the start and end points
- based on magnitudes and directions of edges
- to merge edge into edge chains (partial borders)
- bi-directional heuristic search
- bottom-up control strategy (->ch.10)
ref.
Edge and Line Feature Extraction Based on Covariance Models
IEEE Transactions on Pattern Analysis and Machine Intelligence
Ferdinand van der Heijden, 1995
207p
6.2.5 Border detection as dynamic programming
http://en.wikipedia.org/wiki/Dynamic_programming
: a method of solving problems exhibiting the properties of overlapping subproblems and optimal substructure (described below) that takes much less time than naive methods
Dynamic programming is an optimization method based on the principle of optimality.
(6.22) (8-connected border with n nodes, m-th graph layer)
C(x_k(m+1)) = min ( C(x_i(m) + g(i,k)_(m) )
the number of cost combination computations for each layer = 3n
the total number of cost combination computatios = 3n(M-1) + n
- A-algorithm-based graph search does not require explicit definition of the graph.
- DP presents an efficient way of searching for optimal paths from multiple or unknown starting and ending points.
- Which approach is more efficient depends on evaluation functions and on the quality of heuristics for an A-algorithm.
- DP is faster and less memory demanding for a word recoginition
- DP is more computationally efficient than edge relaxation.
- DP is more flexible and less restrictive than the Hough transform.
- DP is powerful in the presence of noise and in textured images.
live wire; intelligent scissors
: an interactive real-time border detection method combines automated border detection with manual definition of the boundary start point and interactive positioning of the end point.
http://en.wikipedia.org/wiki/Livewire_Segmentation_Technique
In DP, the graph that is searched is always completely constructed at the beginning of the search process.
live lane
: tracing the border by moving a square window whose size is adaptively defined from the speed and acceleration of the manual tracing
+ automated determination of optimal border features from examples of the correct borders
+ specification of optimal parameters of cost transforms
212p
6.2.6 Hough transforms
Hough transform:
objects with known shape and size -- (data processing) --> shape distortion, rotation, zoom -- (moving a mask) --> correlation (determining the pixel with the highest frequency of occurrence) + known information
The purpose of the technique is to find imperfect instances of objects within a certain class of shapes by a voting procedure. This voting procedure is carried out in a
parameter space, from which object candidates are obtained as local maxima in a so-called accumulator space that is explicitly constructed by the algorithm for computing the Hough transform.
http://en.wikipedia.org/wiki/Generalised_Hough_Transform
In the Generalized Hough Transform, the problem of finding the model's position is transformed into a problem of finding the transformation parameter that maps the model onto the image. As long as we know the value of the
transformation parameter, then the position of the model in the image can be determined.
original Hough transform (if analytic equations of object borderlines are known - no prior knowledge of region position is necessary)
--> generalized Hough transform (even if an analytic expression of the border is not known)
Any straight line in the image is represented by a single point in the parameter space and any part of this straight line is transformed into the same point.
Hough transform
1) to determine all the possible line pixels in the image
2) to transform all lines that can go through these pixels into corresponding points in the parameter space
3) to detect the points in the parameter space
The possible directions of lines define a discretization of the parameter.
parameter space -> rectangular structure of cells -> accumulator array (whose elements are accumulator cells)
Lines existing in the image may be detected as high-values accumulator cells in the accumulator array, and the parameters of the detected line are specified by the accumulator array co-ordinates.
-> Line detection in the image is transformed to detection of local maxima in the accumulator space.
-> A noisy or approximately straight line will not be transformed into a point in the parameter space, but rather will result in a cluster of points, (and the cluster center of gravity can be considered the straight line representation.)
- missing parts, image noise, other non-line structures co-existing in the image, data imprecision
Generalized Hough transform
- arbitrary shapes
- partial or slightly deformed shapes, occluded objects
- measuring similarity between a model and a detected object
- robust to image noise
- search for several occurrences of a shape
Randomized Hough transform
221p
6.2.7 Border detection using border location informationd
(1) the location of significant edges positioned close to an assumed border
the edge directions of the significant edges match the assumed boundary direction
-> an approximate curve is computed to result in a new, more accurate border
(2) prior knowledge of end points (assuming low image noise and straight boundaries)
search for the strongest edge located on perpendiculars to the line connecting end points of each partition (; perpendiculars are located at the center of the connecting straight line)
(3) contour detection - active contour models (snakes) (-> 7.2)
user-provided knowledge about approximate position and shape of the required contour
222p
6.2.8 Region construction from borders
methods to construct regions from partial borders
(1)
superslice method
thresholding for which the detected boundaries best coincide with assumed boundary segments
(2) probabilities that pixels are located inside a region closed by the partial borders
A pixel is a potential region member if it is on a straight line connecting two opposite edge pixels.
223p
6.3 Region-based segmentation
to divide an image into zones of maximum homogeneity
225p
6.3.1 Region merging
http://en.wikipedia.org/wiki/State_space_search
The set of states form a graph where two states are connected if there is an operation that can be performed to transform the first state into the second.
6.3.2 Region splitting
6.3.3 Splitting and merging
6.3.4 Watershed segmentation
6.3.5 Region growing post-processing
6.4 Matching
6.4.1 Matching criteria
6.4.2 Control strategies of matching
6.5 Evaluation issues in segmentation
6.5.1 Supervised evaluation
6.5.2 Unsupervised evaluation
6.6 Summary

 asm_overview.pdf


 for some
 .
. 
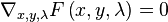
 having non-empty interior, the Lagrangian function
  is defined as
 is defined as
 and any
 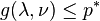 . If a
  .
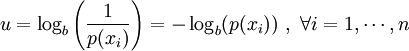
. outcomes is defined by
 , with
  being the average operator, is obtained by